ℹ️ This work was published in Science as Pottinger et al 2024. DOI 10.1126/science.adr3837. This is the detailed continuation of our interactive introduction which overviews the opportunities of a global plastics treaty.
🏁 Start here:
Exploring plastics outcomes under different policy scenarios, this tool starts with mismanaged waste like plastic in the ocean. This overview tab allows you to combine different high level policies to reduce waste. Note that this is a "pre-print" model. Things may shift during the publication process.
Overview Showing Plastic as Million Metric Tons.
Overview
Global 2049 Plastics Projections

Policies


Impact of Policies on Global 2049 Plastics Projections
ℹ️ Your policy selections on the overview tab and this tab are kept in sync.
🏁 Start here:
Exposing additional metrics like sectorial consumption at a regional level, this tab refines your policy options from the first tab, allowing you full control to craft your own unique interventinos.
Details Showing in at as .
Deatils View
Mismanaged Waste
Incinerated Waste
Landfill Waste
GHG (Experimental)
Recycling
EOL
Start of Life
Consumption

Prototype
Simulation
This tab allows you to configure run Monte Carlo simulations to evaluate projections for parameter uncertainty or sensitivity analysis. Note that this will build upon any changes you have made elsewhere in the tool on other tabs.
Settings
This tab allows you to configure the behavior of the application. These choices are independent of both your policy selections and changes to financial and system assumptions. It intends to support ergenomic use of the application per user preference and, as appropriate, use of adaptive technology. Note that changes to these settings will be saved to a small text file on your machine called a cookie. If you return to the application later and the file is still present, you will be given the option to restore your settings a few seconds after the application finishes loading.
Layout
Some views like the details tab may show a policy panel next to visualization describing that policy. Some users may prefer a linear view where the visualization takes up the whole window width.
Colors
By default, the color scheme emphasizes color differences between series (example: to better differentiate end of life fates by color). This may benefit some color blind and low vision users. However, you may prefer a high contrast color scheme which empahsizes difference from colors to the background, helping other low vision users.
Headers
The headers allow for interactivity, manipulating the entire visulization from a single component which also describes the current page's contents. This may help some low motor users or those where navigating elements may take extra time. Some adaptive technologies will read these interactive headers as intended while others provide overly long names. Users may instead select a shorter "static" option which removes the header interactive elements.
Visualizations
For major charts, users can instead request a table instead of a graphical visualization. Note that all data may be exported as well.
Code Editors
Navigating to details about a policy will let users change the code describing the logic for that intervention. This embedded editor environment can be exited by pressing esc. However, some users not wishing to edit the code may prefer to disable these components for a more streamlined experience.
Scrolling
Controlling what subset of available visualizations are visibile on the details tab, the tool offers "advanced scrolling" which may cause scrollable areas inside other scrollable areas. However, some users including those with motor impairments, may prefer to only have more simplified scrolling with a single scrollable area.
Guide Introduction
This guide provides some high level observations from the data as material to complement the tool and serves as a continuation of our interactive introduction. Each section provides a different perspective into these results. The sections:- Introduction: This section.
- Consumption: Consumption projections under business as usual.
- Waste: Waste projections under business as usual.
- Policy: Overview of different common policy options.
- Resources: Links to resources for further reading.
Consumption
Annual global plastic production in business as usual is set to increase more than 22.3 percent from today to 2050 (612.0 million metrics tons in 2024 to 748.6 Mt) in the business as usual scenario.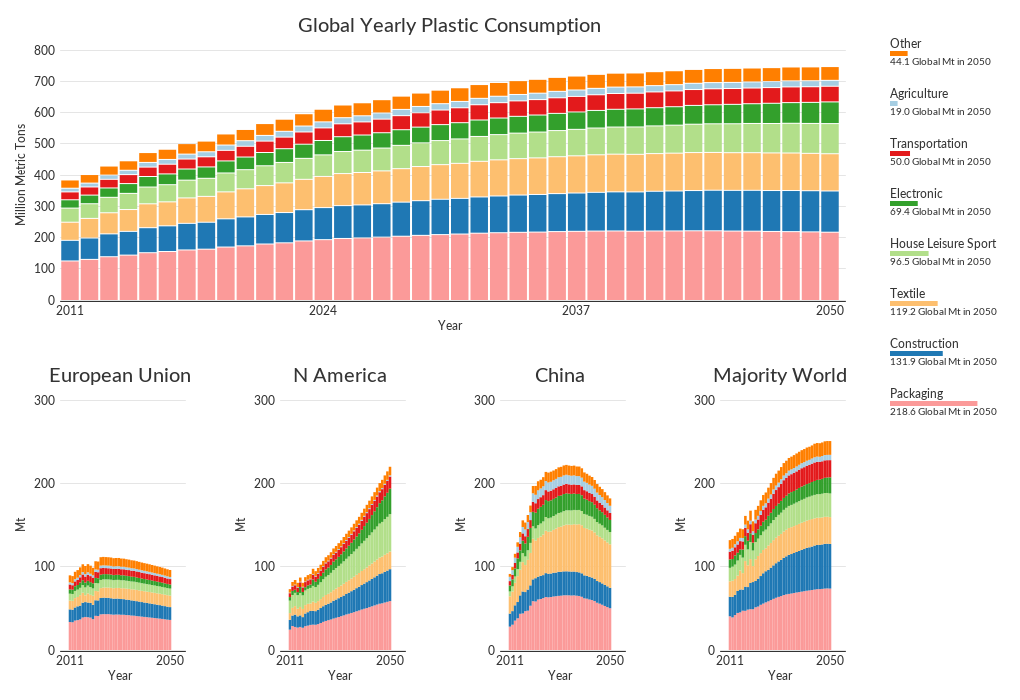
Waste
About 73.5 million metric tons of mismanaged waste is generated per year (2024). That is expected to rise about 64.6 percent in 2050 (120.9 Mt). This business as usual scenario sees the greatest mismanaged burden in "majority world" countries. Specifically, RoW's mismanaged waste is 3.7 times greater than NAFTA, EU 30, and China combined in 2050. Indeed, it accounts for about 78.9 percent of global mismanaged waste in that projection.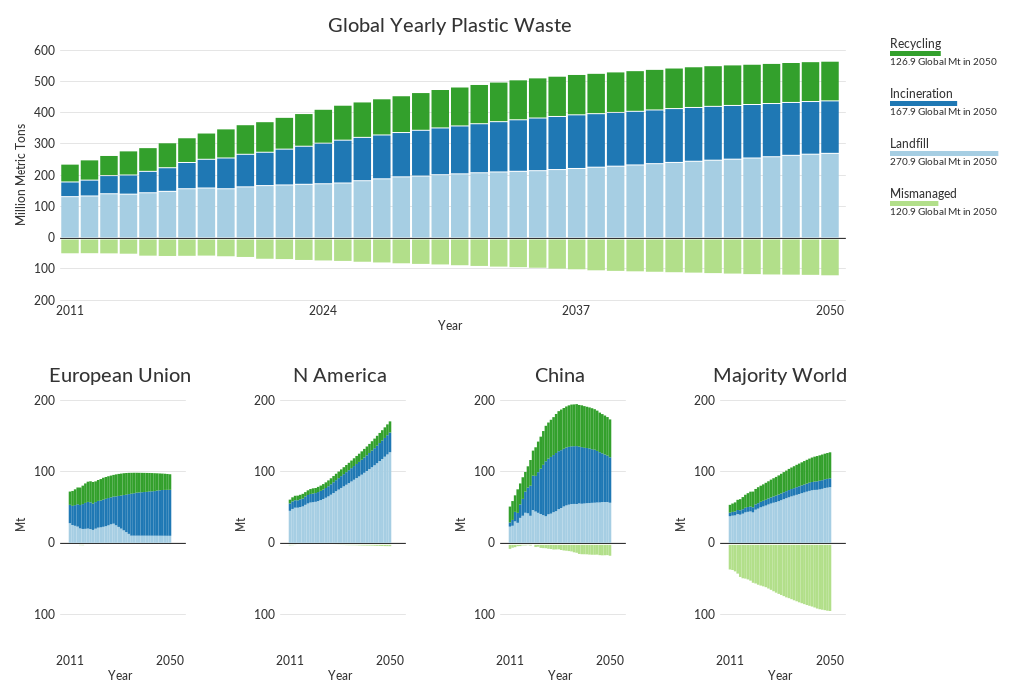
Policy
These numbers could change under different policy scenarios. Five of the options that seem to have a large impact on mismanaged volume:- A Minimum Recycling Content mandate at 40 percent would change annual mismanaged waste by about -51.3 perecent in 2050 (58.9 Mt vs 120.9 Mt without any intervention).
- If capping plastic production to 2020 levels, this simulation expects a change in annual mismanaged waste of -40.7 percent in 2050 (120.9 BAU Mt in 2050 to 71.7 Mt).
- A 90 percent reduction on other single-use packaging beyond polystyrene would change mismanaged waste by -17.5 Mt globally, by 2050.
- With this in mind, a consumer tax on packaging would change mismanaged waste by -24.4 Mt globally, by 2050.
- Taxes could fund investment. A 100 billion investment in recycling would increase recycling by 99.7 percent (253.5 vs BAU 126.9 Mt) and change mismanaged waste (91.1 with investment vs 120.9 Mt) by -24.7 percent.Meanwhile, 100 billion for waste infrastructure changes mismanaged waste by -39.1 percent (73.6 with investment vs 120.9 Mt).
- A ban on Polystyrene Packaging would only change mismanaged waste by -0.6 Mt but addresses a type of often mismanaged polymer found frequently occurring in ocean plastics mass.
- There are some concerns about additives even if their volume is not large. Removing 90 percent of additives would change mismanaged waste by -1.1 Mt but these still may be important materials to remove.
- Though banning it changes mismanaged waste only by -0.5 Mt (in part since some nations have already started reducing waste imports), a policy to ban waste trade may still serve equity goals.
With this background in mind, this tool allows users to explore these policies in various scenarios like the following:
- Without intervention, the 3470 Mt global mismanaged waste produced between 2011 and 2050 would tower roughly 2.4 miles into the sky (3.8 km) if placed over Manhattan in New York City (using plastic bottles to represent that waste). In 2050 alone, 120.9 Mt would be produced, reaching 0.08 miles into the sky (0.13 km).
- With a low ambition treaty, this tower decreases to 2729 Mt and would reach 1.87 miles into the sky (3.01 km) if placed over Manhattan in New York City (using plastic bottles to represent that waste). In 2050 alone, 78.4 Mt would be produced, reaching 0.05 miles into the sky (0.09 km).
- With a high ambition treaty using all of these policies, this tower decreases to 1525 Mt and would reach 1.0 miles into the sky (1.7 km) if placed over Manhattan in New York City (using plastic bottles to represent that waste). In 2050 alone, 13.0 Mt would be produced, reaching 0.01 miles into the sky (0.01 km).
Note about recycling: in addition to a Minimum Recycling Content (MRC) mandate, one may also consider a Minimum Recycling Rate (MRR). A 30 percent MRR changes annual mismanaged waste by -24.5 in 2050 (91.3 Mt). In contrast, recall that a MRC at 30 percent would change annual mismanaged waste by about -51.3 perecent in 2050 (58.9 Mt vs 120.9 Mt without any intervention). All that said, these two policies could complement each other and be implemented together. Note MRC dictates how much of new plastic products must come from recycled materials. Meanwhile, MRR dictates how much of plastic waste must be collected for recycling regardless of if those materials are used.
Resources
To understand these trends, consider reviewing other resources on variables that may be related to plastics behavior: These variables are considered in the machine learning model used to build this tool's projections.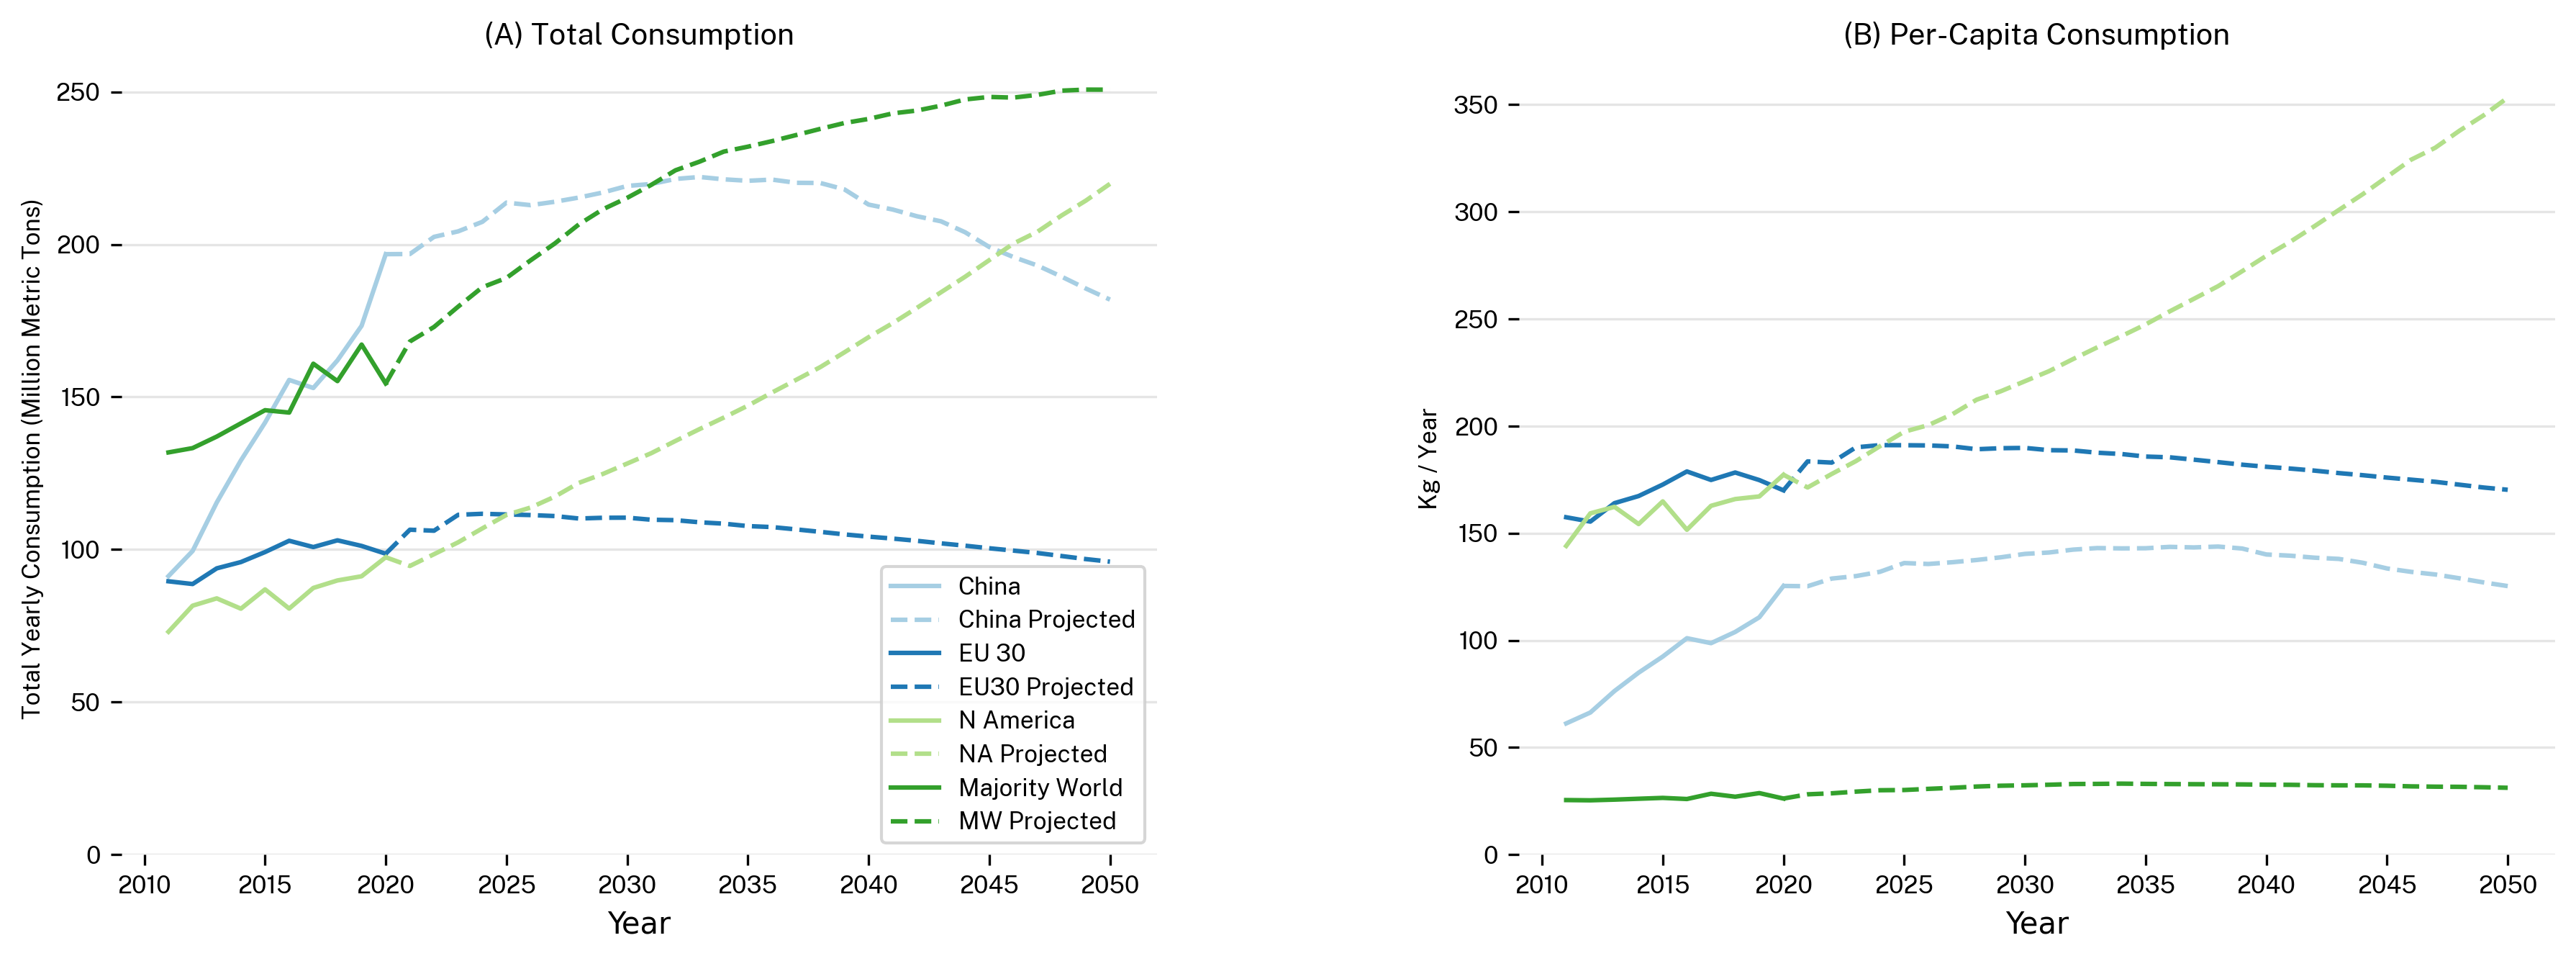
About
This project allows users to explore different plastics outcomes under various policy scenarios, offering the ability to craft highly customized policy packages and to build new policy interventions through an embedded programming environment. This tool is both a continuation of our interactive introduction and is a deployment of open source code built as a joint project of:- Benioff Ocean Science Laboratory at University of California Santa Barbara
- Eric and Wendy Schmidt Center for Data Science & Environment at University of California Berkeley
Model Information
Note that the current model should be treated as "in pre-print" and, in addition to expanded documentation / discussion, predictions may evolve as this project goes into publication. That said, this effort uses a mixture of techniques to accomplish both projection of business as usual as well as simulate different policy interventions. For more details, see the technical model write up.- Consumption is modeled through random forest and uses historic data as well as GDP per-capita (USD 2010 PPP) and population projections.
- Waste is modeled through random forest and uses historic data as well as GDP per-capita (USD 2010 PPP) and population projections.
- Goods / materials trade is modeled through random forest and uses historic data as well as GDP per-capita (USD 2010 PPP) and population projections.
- Waste trade is modeled through random forest and uses historic data as well as GDP per-capita (USD 2010 PPP), population projections, and a flag indicating before / after implementation of China's National Sword.
- Interventions are mechanistic as described in their intervention supporting documentation.
- Consumption sees a test MAE of 1.0 Mt. It should be mentioned that there are a relatively large number of classes of consumption.
- Waste sees a test MAE of 0.01 Mt. This tool highlights that there are only 4 classes of fates.
- Goods trade sees a test MAE of 1.57 Mt. This project notes an important degree of change in this metric over time in the historic dataset.
- Waste trade sees a test MAE of 1.15 Mt. It is worth mentioning that this metric has had major shifts due to policy like China's National Sword.
- Consumption sees an out of sample MAE of 1.15 Mt.
- Waste sees an out of sample MAE of 0.02 Mt.
- Goods trade sees an out of sample MAE of 2.06 Mt.
- Waste trade sees an out of sample MAE of 1.56 Mt.
- Hidden test set MAE: 0.2
- Out of sample test MAE: 0.08
- Consumption: As the actual response vaiable in the model is change in consumption, results are reported as MAE in delta Mt. That said, this MAE stays under an acceptable 2.5 Mt for all regions in the trials though EU 30 and NAFTA tend to stay under 1 Mt whereas China and majority world may be around 1.5 Mt in practice.
- Waste: As the actual response variable in the model is percent of waste, results are reported as MAE in percentage points. These stay under an acceptable 3% in all trials though China and EU 30 are seen going above 1% while RoW and NAFTA tend to stay below 1% Mt.
- Goods trade: As the actual response vaiable in the model is percent traded, results are reported as MAE in percentage points. These stay under an acceptable 4% (note this is larger than some other trade numbers) in all cases with only China being notable with MAE over 2%
- Waste trade: As the actual response variable in the model is precent traded, results are reported as MAE in percentage points. These stay under an acceptable 3% without any region having a notably divergent distribution of MAEs.
- Download section has additional information and detailed projections.
- Pipeline repository for more information about the business as usual model.
- Interventions document repository for high level information about the interventions and their design.
- The pt subdirectory for technical information and code for interventions.
- Put % single use into monte carlo and center default yield loss on 2024-09-09.
- Switch to PPP for tax on 2024-09-07.
- Expanded Monte Carlo (includes tax) on 2024-09-06.
- Monte Carlo options on 2024-09-05.
- Additional update to GHG assumptions for mismanaged waste on 2024-09-02.
- Update to GHG assumptions including adding a small mismanaged intensity on 2024-08-30.
- Minor labeling touch up and non-substantial update to single use packaging percentages 2024-08-27.
- Standardize million metric tons notation as "Mt" on 2024-06-23.
- Minor stability update to GHG calculation on 2024-06-21.
- Changed default virgin cap to 2020 levels on 2024-06-21.
- Changed Rest of World to Majority World and NAFTA to North America on 2024-06-21.
- Added packaging-only versions of some levers on 2024-05-25.
- Updates to capex / opex costs for incineration and landfill on 2024-05-22.
- Resolved bug (overall results generally unchanged) in determining trade effects and minor imprecision in virgin cap on 2024-05-21.
- Fix to EU30 definition in future population projections on 2024-05-18.
- Updates to EU30 definition and incorporation of new model training data on 2024-05-17.
- Column names improved on 2024-02-14.
- Polymer-level tracking and GHG (under feature flag) added on 2024-02-18.
- Fully comphrehensive tracking of secondary consumption with new polymer-level data added on 2024-02-21.
- Made global GHG public on 2024-02-22.
- Production polymer balancing to ensure trade on 2024-03-07.
- Simplification of polymer-level trade which is slightly less noisy on 2024-03-08.
- Update default assumption for added material required for reuse on 2023-03-27.
- Update reuse with addressable products parameter on 2024-04-05.
- EU30: The EU-27 as of June 20, 2024 as well as the United Kingdom, Switzerland, and Norway
- NA: Members of the former NAFTA (United States of America, Mexico, and Canada).
- Majority World: All countries except those in EU30, NA, and China.
Contact Information
We have multiple methods of following up:- For general communication about this tool including for inquires regarding privacy and data, please send an email to our project inbox.
- For feature requests, bug reports, and code contributions, please visit the project issue tracker. Thank you for your contribution.
- To contact the UC Santa Barbara team specifically, see the BOSL contact form.
- To contact the UC Berkeley team, see the DSE contact form.
License and Terms
This project's source is available on GitHub at SchmidtDSE/plastics-prototype. See below for licensing details:- Application and source code are available under the BSD License.
- Data including exports from this tool are made available under the CC BY-NC 4.0 License.
- The content of this website is available under the CC BY-NC 4.0 License.
People and Funding
The copyright for this software is "(c) 2024 Regents of University of California" and our central inbox can be used to contact us with any inquires. A big thank you to the authors:- Sam Pottinger DSE, UC Berkeley: Software engineering, lead machine learning / AI, business as usual modeling, policy modeling, lead UX / design (this tool), lead data visualization (this tool), CI / CD, language engineering. Co-first author.
- Roland Geyer UCSB: Principal investigator, business as usual modeling, policy modeling, policy research, plastics domain knowledge. Co-first author.
- Nivedita Biyani BOSL, UCSB: Policy research, policy modeling, business as usual modeling, plastics domain knowledge. Co-first author.
- Ciera Martinez DSE, UC Berkeley: Program management, communications, outreach, advisor, tutorial and new user flow.
- Neil Nathan BOSL, UCSB: Communications, outreach, media, data visualization (landing page), UX / design (landing page), overview tab design.
- Molly Morse BOSL, UCSB: Program management, communications, outreach, media, data visualization (landing page), UX / design (landing page), overview tab design.
- Magali de Bruyn DSE, UC Berkeley: Guidance on programming portals, CI / CD, and DSL feedback.
- Carl Boettiger DSE, UC Berkeley: Advisor.
- Elijah Baker BOSL, UCSB: Policy research.
- Kevin Koy DSE, UC Berkeley: Executive leadership, advisor, overview tab design.
- Douglas McCauley BOSL, DSE, UCSB, UC Berkeley: Executive leadership, policy modeling, policy reserach, communications, outreach, media, data visualization, UX / design. Co-first author.
- Kelly Wang BOSL, UCSB: Communications
- Linda Nakasone Community: Community provided bug reports.
- ThoughtLab Agency: Development for the landing page.
Publication
Please cite Pottinger et al 2024 (DOI: 10.1126/science.adr3837).Table of Contents
- Settings and Accessibility
- About
- About: Contact information
- About: License
- About: Model
- About: Monte Carlo
- About: People and Funding
- About: Privacy
- About: Publication (how to cite)
- About: Tool overview
- Details
- Details: Controls for visualization
- Details: Controls for file
- Details: Consumption summary
- Details: Cross-region visualization
- Details: Policy customization / fine-tuning
- Details: Start of life summary
- Details: End of life / waste summary
- Details: Timeseries graph
- Downloads
- Downloads: Business as usual projections
- Downloads: Pipeline outputs
- Downloads: Standalone engine
- Downloads: Standardized Snapshot
- Guide
- Guide: Consumption
- Guide: Introduction and start page
- Guide: Policy
- Guide: Resources
- Guide: Waste
- Implementation Details: Additives
- Implementation Details: Consumption tax
- Implementation Details: Engine
- Implementation Details: GHG and Polymers
- Implementation Details: Incineration investment
- Implementation Details: Machine Learning
- Implementation Details: Max mismanaged rate
- Implementation Details: Min recycled content
- Implementation Details: Min recycling rate (collection)
- Implementation Details: Recycling investment
- Implementation Details: Reduce packaging
- Implementation Details: Reduce polystyrene
- Implementation Details: Virgin plastic cap
- Implementation Details: Waste management investment
- Implementation Details: Waste trade
- Interactive Introduction
- Open source repository
- Overview
- Overview: Controls for policy
- Overview: Controls for file
- Overview: Impact of policies
- Overview: Policy scenario selector
- Overview: Summary statistics
- Overview: Timeseries graph